The Latest Reporting Upgrade Has Arrived!
Google Analytics 4 is here! Get the scoop on all of this month’s updates.
What’s new?
This month, we’re rolling out a major reporting upgrade to integrate Google Analytics 4 with our systems.
Monthly reports have received a minor cosmetic upgrade to improve labels and provide metric definitions.

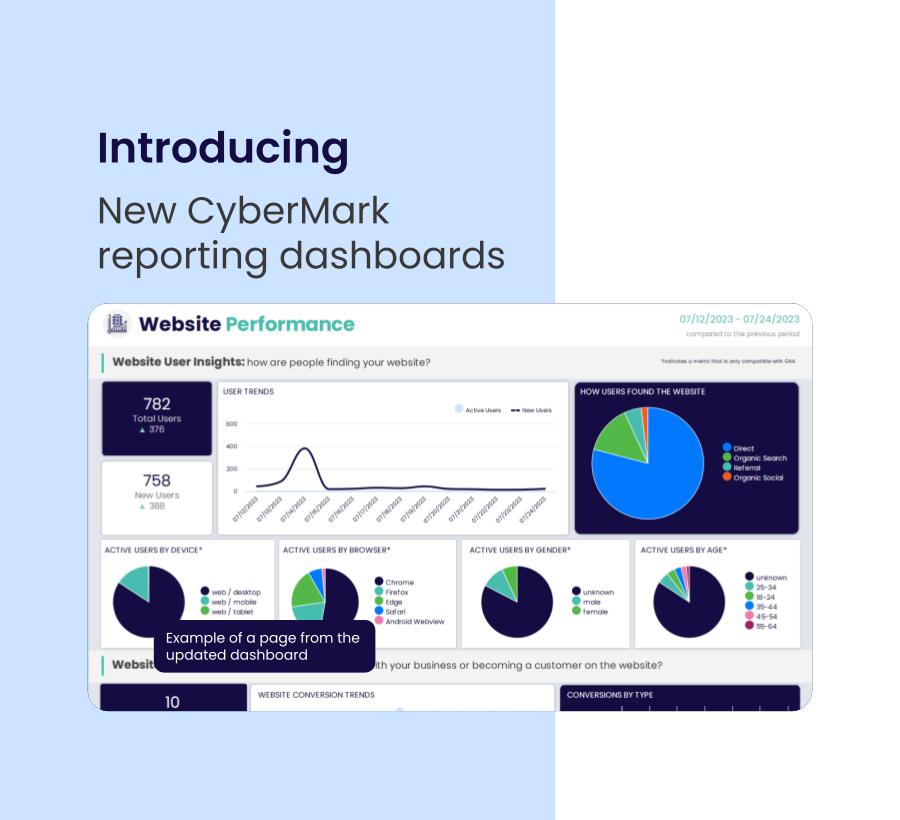
Reporting dashboards have undergone a makeover and features have been upgraded.

All clients will be upgraded to the new reporting dashboard automatically on July 28th. Monthly reports will include GA4 metrics starting with August’s report, which will contain July’s data.
What is the purpose of marketing reports?
Industry expert Jay Baer wrote in a 2021 post, “The future of marketing isn’t big data. It’s big understanding.” Every platform used in digital marketing exports tons of different metrics and KPIs – so much so that it’s easy to overlook the big picture. The ultimate goal of a marketing report is to help you understand how different online channels help your brand achieve three goals:
- Increase online visibility
- Increase online traffic
- Increase online action
Visibility is a measurement of how easy it is for customers to find your business online. The primary metric to look at is views, or impressions, which refers to any time your business’ listing/ad/website/etc. was shown on any screen. When we’re looking at online visibility, we want to know which channels are the most successful in getting our message out to more people and helping them find the website.

Traffic is a measurement of how many customers visited your website or clicked on a listing/ad/search result/etc. to learn more about your business. When we evaluate traffic, we look at which channels are driving traffic the most effectively and how traffic metrics are trending over several months.

Action is measured by online conversions. Conversions are actions that people can take on your website to convert into a customer, such as filling out a form, calling, booking online, etc. Related metrics to watch are the average cost per conversion and conversion rate.

Monthly Report VS Dashboard: Which one should I look at?
The short answer is: it depends on what you want to know!

The monthly report provides a high-level overview of the most important KPIs for each of the marketing channels enrolled in active services. We recommend using the monthly report to get a quick glance at your online performance last month and the trends over the last 12 months.
The reporting dashboard provides access to all the KPIs associated with each marketing channel. We recommend using the dashboard for analyzing performance across long periods of time or deep-diving specific channels. You can also export data to a CSV for use with your own reporting tools.

Best Practices for Reading the Reports
Now that you know the basics of reading the reports, it’s time to put your knowledge to the test! Keep an eye out for your report in the first week of the month. We’ll send you the most important metrics to keep an eye on across various digital marketing channels.
- Know the basics: the monthly reports include definitions for the most important 1-4 KPIs per channel. Additional definitions can be found in our glossary.
- Compare to real-world data: While digital marketing metrics may not directly correlate with business metrics, such as revenue or new customers, they are related. Examples of important business metrics to consider are:
- Average customer lifetime value
- Average time to close a sale
- Average lead => sale conversion rate
- Average cost to acquire a customer
- Assess your goals: by knowing how much it costs to acquire a customer and how many leads you need to generate, you can set goals for digital marketing. Perhaps you need to sell more of a certain product, so you add content to the website to educate customers and promote the product. Maybe it’s a slow season and you want to increase budget to boost lead generation. Whatever the situation, having clear goals is essential for a good marketing strategy.
- Schedule a review: If your service includes a performance review call, we can provide recommendations to help achieve your goals. Check out this article for more information on scheduling a call and what to expect.
- Don’t overanalyze small fluctuations: Digital marketing can be turbulent month over month and even day to day. Online platforms are changing all the time, and consumer behavior is more varied than ever before. It’s normal to see some fluctuations in data. Making reactive changes can worsen performance.
- Plan ahead: Get ahead of future marketing campaigns by planning them out in advance (3-6 months). This puts your specialist in the best position to recommend a strategy and develop campaigns for holidays, seasonal promos, etc.
How to read the reports
Click on the links below for a video guide to reading each of CyberMark’s reports.
- How to read the monthly reports
- How to use the reporting dashboard
- Reporting 101 – overview of reports
Report questions and feature requests
If your report appears to be missing data from a channel that CyberMark manages for you (such as Google Business, the website, ad platforms, etc.), reach out to marketing@cybermark.com. We can also help if you didn’t receive the report or need a new copy. If you would like to suggest a new feature for reporting, please submit a request via the CyberMark Client Success Center. Feature requests will be assessed and road-mapped on a case-by-case basis. Not all feature requests will be accepted, however, if you would like a custom report for your business, that can be accommodated for an additional cost.